In today’s data-driven world, businesses generate massive amounts of information from marketing campaigns, sales activities, customer behavior, and operations. Managing this data manually using spreadsheets is slow, error-prone, and inefficient.
This is why reporting automation tools (also called BI tools or data reporting software) are becoming essential for modern businesses. These tools automatically collect, process, and visualize data in real time, helping teams make faster and more accurate decisions.
Whether you are a marketer, analyst, or business owner, choosing the right reporting automation software can significantly improve productivity, accuracy, and overall performance.
Best Reporting Automation Tools Comparison (2026)
|
Tool |
Best For |
Pricing (Starting) |
Free Plan |
Rating |
|
Improvado |
Marketing analytics & agencies |
Custom pricing |
No |
4.5/5 |
|
Tableau |
Advanced data visualization |
From $70/month |
No |
4.6/5 |
|
Microsoft Power BI |
Business intelligence & reporting |
From $10/month |
Yes |
4.7/5 |
|
Looker Studio |
Beginners & marketers |
Free |
Yes |
4.4/5 |
|
Klipfolio |
KPI dashboards |
From $90/month |
No |
4.3/5 |
|
Zoho Analytics |
Budget-friendly analytics |
From ₹960/month |
Yes |
4.5/5 |
|
Domo |
Enterprise reporting |
Custom pricing |
No |
4.4/5 |
|
Databox |
Simple KPI tracking |
Free + Paid plans |
Yes |
4.5/5 |
|
Sisense |
Large-scale data analytics |
Custom pricing |
No |
4.6/5 |
|
Google Analytics 4 |
Website performance tracking |
Free |
Yes |
4.5/5 |
What Are Reporting Automation Tools?
Reporting automation tools are software platforms that automatically collect data from multiple sources, analyze it, and generate structured reports or dashboards.
Instead of manually creating reports in Excel, these tools:
- Pull data from various platforms (CRM, ads, databases)
- Clean and organize the data
- Generate visual dashboards and reports
- Update data in real-time or scheduled intervals
They are widely used across marketing, finance, operations, and business intelligence.
Why Reporting Automation Tools Are Important
Modern businesses rely heavily on accurate and timely data. Manual reporting slows down decision-making and increases the risk of errors.
Key Importance
- Eliminates manual reporting work
- Improves data accuracy
- Provides real-time insights
- Speeds up decision-making
- Increases team productivity
- Supports business scalability
Top 10 Reporting Automation Tools in 2026
1. Improvado
Improvado is an enterprise-grade reporting automation platform designed specifically for marketing data aggregation and performance analytics. It helps businesses collect data from multiple advertising platforms, CRM systems, and analytics tools into one centralized dashboard. The platform automates data extraction, transformation, and visualization, removing the need for manual reporting. With AI-powered insights, it helps marketers identify trends and optimize campaigns faster. It is highly scalable and suitable for large organizations managing complex multi-channel marketing data. Improvado is widely used by agencies and enterprises that require advanced reporting automation.
Best For
- Marketing agencies
- Large enterprises
- Multi-channel campaign management
- Data-driven marketing teams
Key Features
- AI-powered analytics
- Cross-channel data integration
- Real-time reporting dashboards
- Advanced API integrations
Pricing
- Freemium (Free plan available)
- Paid plans start from approx. $7/user/month
Pros
- Built specifically for marketing
- Eliminates manual reporting
- Highly scalable
Cons
- Limited beyond marketing use
- Setup can be complex
- Premium pricing
2. Tableau

Tableau is a leading business intelligence and data visualization tool used by enterprises worldwide. It allows users to convert raw and complex datasets into interactive dashboards and visual reports. The platform is known for its powerful drag-and-drop interface and deep analytical capabilities. Tableau helps organizations discover patterns, trends, and actionable insights from large datasets. It supports advanced analytics and AI-driven insights for better decision-making. Due to its flexibility and performance, it is widely used in enterprise-level reporting and analytics environments.
Best For
- Enterprises
- Data analysts
- Business intelligence teams
- Large datasets
Key Features
- Interactive dashboards
- Advanced data visualization
- AI-driven insights
- Drag-and-drop interface
Pricing
- Paid plans start from approx. $70/user/month (billed annually).
- A free trial is available.
Pros
- Industry-leading visuals
- Highly customizable
- Strong analytics capabilities
Cons
- Expensive pricing
- Steep learning curve
- Requires training
3. Microsoft Power BI
Microsoft Power BI Microsoft Power BI is a powerful and cost-effective reporting automation tool designed for businesses of all sizes. It integrates seamlessly with Microsoft products like Excel, Azure, and Teams. The platform enables users to create real-time dashboards and automated reports with ease. Power BI is known for its strong data modeling and visualization capabilities. It helps organizations analyze business performance and make data-driven decisions quickly. Its affordability and user-friendly interface make it one of the most popular BI tools globally.
Best For
- Small to large businesses
- Microsoft users
- Data analysts
- Reporting teams
Key Features
- Excel and Microsoft integration
- Real-time dashboards
- AI-powered insights
- Cloud-based reporting
Pricing
- Freemium (Free plan available)
- Paid plan starts from approx. $10/user/month
Pros
- Affordable pricing
- Easy to use
- Strong integrations
Cons
- Limited advanced customization
- Performance issues with large data
- Requires Microsoft ecosystem
4. Looker Studio
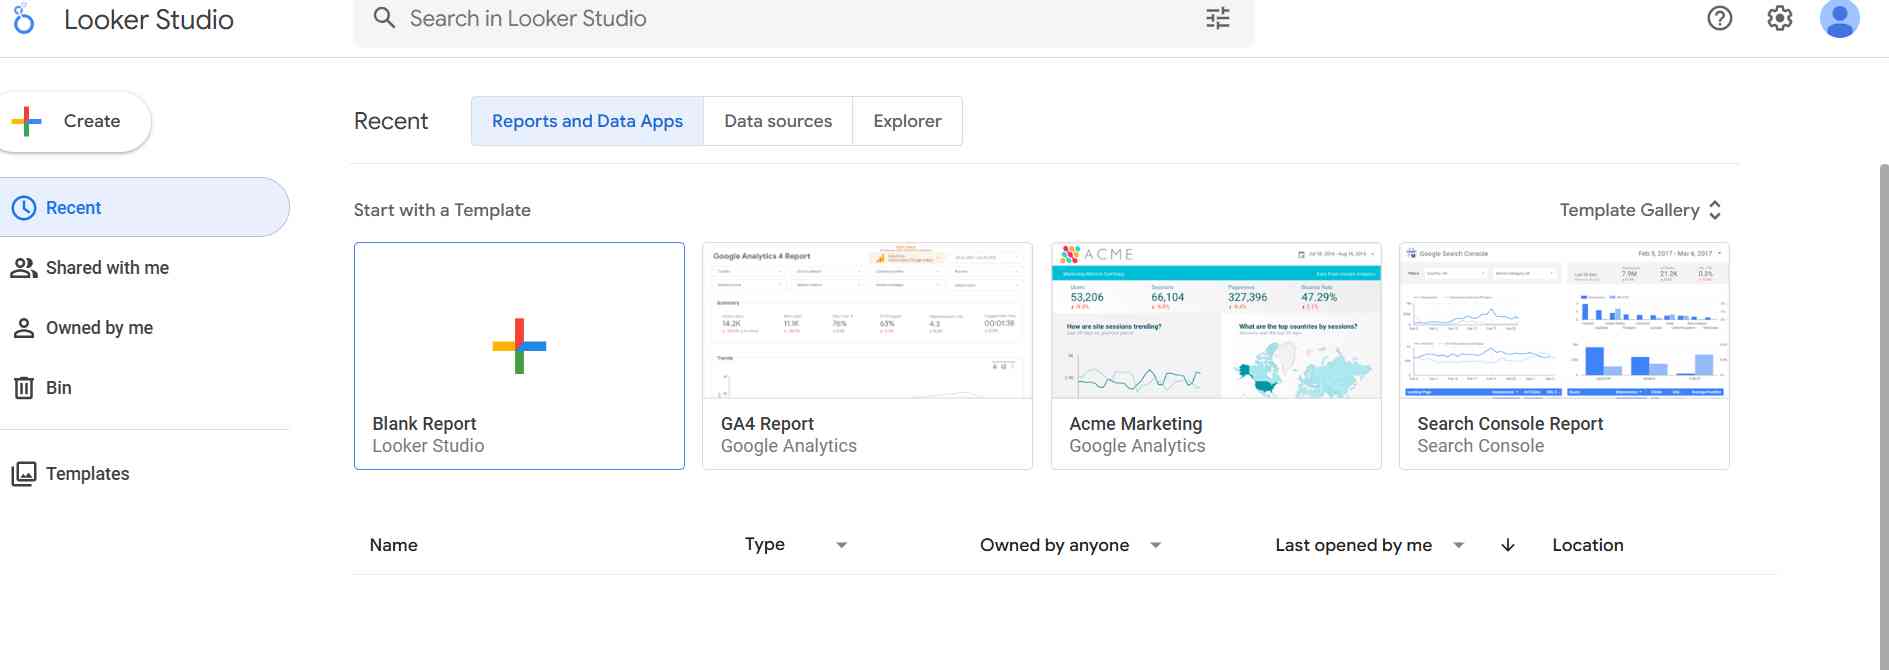
Looker Studio is a free reporting and data visualization tool developed by Google. It allows users to create interactive dashboards using data from Google Analytics, Google Ads, Sheets, and other sources. The tool is highly beginner-friendly and does not require coding skills. It is widely used by marketers and small businesses for simple reporting needs. Looker Studio enables easy sharing and collaboration on reports. Its seamless integration with Google ecosystem tools makes it a powerful entry-level reporting solution.
Best For
- Beginners
- Digital marketers
- Small businesses
- Google ecosystem users
Key Features
- Free dashboard creation
- Google integrations
- Easy report sharing
- Customizable templates
Pricing
- Completely free to use
Pros
- Completely free
- User-friendly interface
- Easy integrations
Cons
- Limited advanced features
- Basic customization
- Not ideal for large data
5. Klipfolio
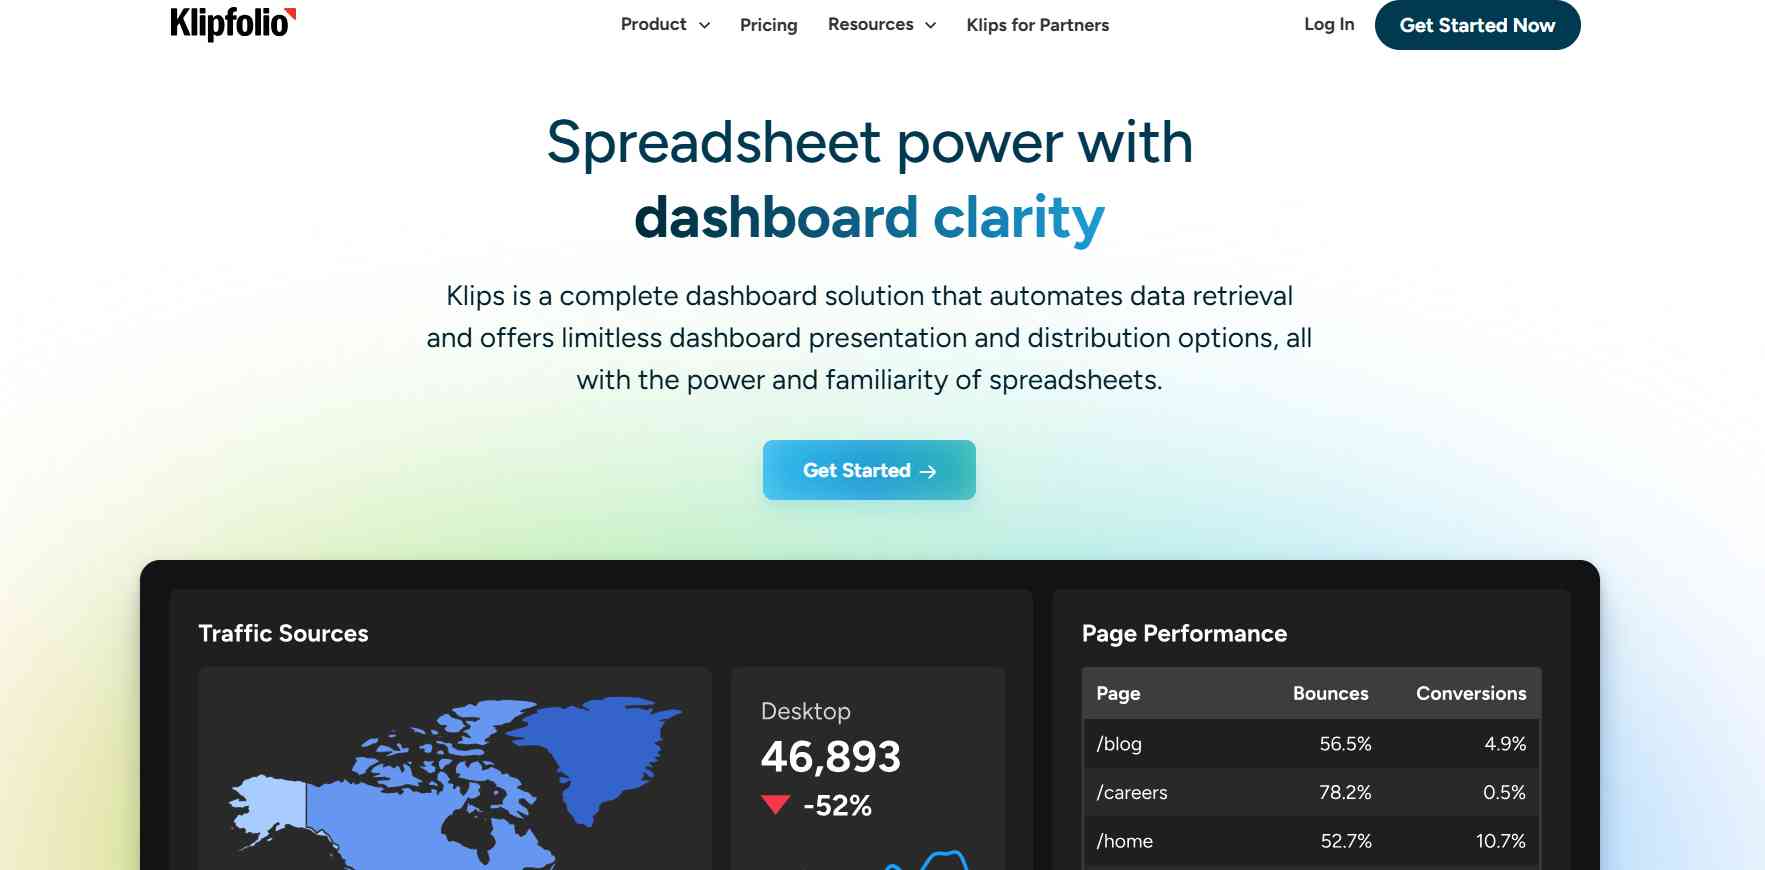
Klipfolio is a cloud-based reporting tool focused on real-time KPI tracking and performance dashboards. It allows users to build customizable dashboards that pull data from multiple sources. The platform is designed for small and medium-sized businesses that need quick insights into business performance. Klipfolio helps teams monitor key metrics in real time and improve decision-making speed. It offers a simple interface with strong integration capabilities. It is widely used for operational and performance reporting.
Best For
- Small businesses
- Startups
- KPI tracking
- Performance monitoring
Key Features
- Real-time dashboards
- KPI tracking tools
- Cloud-based access
- Multiple integrations
Pricing
- Paid plans start from approx. $99/month. No free plan available.
Pros
- Easy to set up
- Affordable
- Good for KPI tracking
Cons
- Limited advanced analytics
- Basic UI design
- Not for large enterprises
6. Zoho Analytics
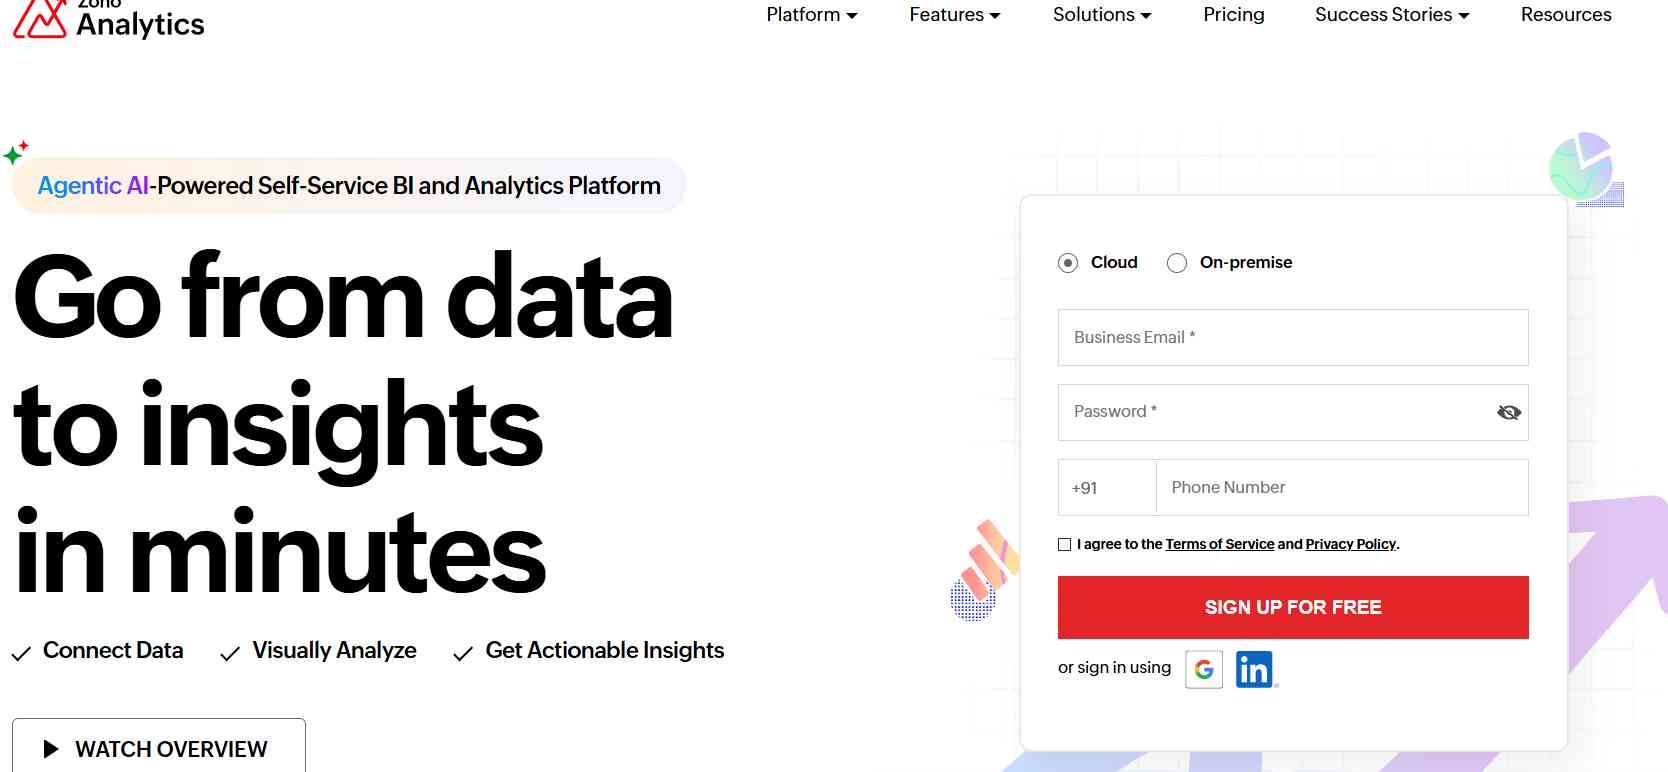
Zoho Analytics is a budget-friendly business intelligence and reporting platform designed for small and medium-sized businesses. It provides powerful data visualization, AI-powered insights, and automated reporting features. Users can connect multiple data sources and create detailed dashboards without technical expertise. The platform is known for its affordability and ease of use. It helps businesses analyze sales, marketing, and operational data effectively. Zoho Analytics is a strong choice for organizations looking for cost-effective reporting solutions.
Best For
- Small & medium businesses
- Budget users
- Beginners
- Data reporting teams
Key Features
- AI-powered assistant
- Automated reporting
- Data visualization tools
- Multiple data connectors
Pricing
- Paid plans start from approx. ₹960/month. Free trial available.
Pros
- Cost-effective
- Easy to use
- Good AI features
Cons
- Limited enterprise features
- Slower with large data
- Fewer advanced options
7. Domo
Domo is an enterprise-level cloud-based analytics and reporting platform designed for real-time decision-making. It brings together data integration, visualization, and collaboration in a single system. The platform allows organizations to monitor key performance metrics from anywhere. Domo is highly scalable and suitable for data-heavy enterprises. It provides advanced dashboards and real-time reporting capabilities. It is widely used by large organizations that require centralized data management and fast insights.
Best For
- Large enterprises
- Data-heavy organizations
- Executive dashboards
- Real-time reporting
Key Features
- Real-time data integration
- Mobile dashboards
- Cloud-based reporting
- Collaboration tools
Pricing
- Custom pricing (available on request after demo or consultation)
Pros
- Highly scalable
- Powerful features
- Strong real-time data
Cons
- Expensive
- Complex setup
- Requires training
8. Databox
Databox is a simple and intuitive reporting automation tool designed for KPI tracking and performance monitoring. It provides pre-built dashboard templates that make setup quick and easy. The platform is ideal for marketers, startups, and small businesses that need fast access to key metrics. Databox allows users to track performance in real time across multiple channels. It supports mobile-friendly dashboards for on-the-go monitoring. It is widely appreciated for its simplicity and ease of use.
Best For
- Marketing teams
- Small businesses
- KPI tracking
- Beginners
Key Features
- Pre-built templates
- Real-time dashboards
- Easy integrations
- Mobile access
Pricing
- Freemium (Free plan available)
- Paid plans start from approx. $72/month
Pros
- Beginner-friendly
- Fast setup
- Clean interface
Cons
- Limited customization
- Basic analytics
- Not for large datasets
9. Sisense
Sisense is a powerful business intelligence and analytics platform designed for handling large and complex datasets. It offers advanced embedded analytics and highly customizable dashboards. The platform is suitable for enterprises that require deep data analysis and flexible reporting systems. Sisense enables users to process large volumes of data efficiently. It supports AI-driven insights and advanced data modeling. It is commonly used by data-driven organizations with complex analytics needs.
Best For
- Data-heavy companies
- Enterprises
- Developers
- Advanced analytics
Key Features
- Embedded analytics
- High-performance processing
- Custom dashboards
- Scalable architecture
Pricing
- Custom pricing (varies based on business requirements and features)
Pros
- Handles big data
- Highly flexible
- Strong performance
Cons
- Complex setup
- Requires technical knowledge
- Expensive
10. Google Analytics 4 (GA4)
Google Analytics 4 is a widely used web and app analytics tool that provides deep insights into user behavior and traffic performance. It tracks events, conversions, and engagement across websites and applications. GA4 helps businesses understand customer journeys and improve digital marketing strategies. It offers real-time reporting and automated insights. The platform is free to use and integrates easily with other Google tools. It is an essential tool for digital marketers and website owners..
Best For
- Website owners
- Digital marketers
- E-commerce businesses
- Content creators
Key Features
- Traffic and user tracking
- Event-based analytics
- Real-time reporting
- Free usage
Pricing
- Free plan available
- GA4 360 (enterprise version) has custom pricing
Pros
- Free tool
- Industry standard
- Powerful insights
Cons
- Complex interface
- Limited business reporting
- Learning curve
Reporting Automation Tools Pricing Comparison (2026)
|
Tool |
Starting Price |
Free Plan |
Pricing Type |
|
Improvado |
Custom (starts ~$7/user/month) |
Yes |
Subscription / Custom |
|
Tableau |
From $70/user/month |
No |
Subscription |
|
Microsoft Power BI |
From $10/user/month |
Yes |
Freemium |
|
Looker Studio |
Free |
Yes |
Free |
|
Klipfolio |
From $99/month |
No |
Subscription |
|
Zoho Analytics |
From ₹960/month |
Yes |
Freemium |
|
Domo |
Custom pricing |
No |
Enterprise |
|
Databox |
From $72/month |
Yes |
Freemium |
|
Sisense |
Custom pricing |
No |
Enterprise |
|
Google Analytics 4 |
Free |
Yes |
Free / Enterprise (GA4 360 |
Best Reporting Automation Tools by Use Case
Choosing the right tool depends on your specific needs. Here are the best picks:
- Best Overall: Microsoft Power BI
- Best for Enterprises: Tableau, Domo
- Best Free Tool: Google Analytics 4, Looker Studio
- Best for Marketing Teams: Improvado
- Best for Beginners: Databox
- Best Budget Option: Zoho Analytics
- Best for Large Data Processing: Sisense
Key Features of Reporting Automation Tools
To choose the right reporting automation tool, it’s essential to understand the core features that define its performance, usability, and value. The best tools combine data integration, automation, visualization, and AI to deliver accurate and real-time insights.
1. Data Integration
A powerful reporting tool should seamlessly connect with multiple data sources, including CRM systems, marketing platforms, databases, and cloud applications. This ensures all your data is centralized in one place for unified analysis.
2. Automated Data Collection
These tools automatically gather and update data from connected sources, eliminating the need for manual data entry and reducing the chances of human error.
3. Real-Time Dashboards
Real-time dashboards allow users to monitor performance metrics as they happen. This helps businesses respond quickly to changes and make timely decisions.
4. Report Scheduling & Automation
Advanced tools enable automatic report generation and delivery at scheduled intervals daily, weekly, or monthly saving time and ensuring consistency in reporting.
5. Data Visualization
Data is transformed into visually engaging formats such as charts, graphs, and KPI dashboards. This makes complex data easier to understand and analyze.
6. Custom Report Builder
Most tools offer drag-and-drop functionality, allowing users to create fully customized reports tailored to their specific business needs without requiring technical expertise.
7. Collaboration & Sharing
Teams can easily share dashboards and reports with stakeholders. Features like role-based access control ensure that the right people have access to the right data.
8. AI-Powered Insights & Predictive Analytics
Modern reporting tools use artificial intelligence to identify trends, generate insights, and forecast future outcomes. This helps businesses make proactive and data-driven decisions.
9. Data Security & Compliance
Top reporting tools prioritize data protection by offering encryption, secure access controls, and compliance with industry standards, ensuring sensitive business data remains safe.
Benefits of Reporting Automation Tools
Reporting automation tools offer significant advantages for businesses looking to improve efficiency, accuracy, and decision-making. By automating repetitive reporting tasks, these tools transform how organizations handle data and insights.
1. Saves Time and Effort
Manual reporting can take hours or even days to complete. Reporting automation tools streamline the entire process, reducing report creation time from hours to minutes and freeing up valuable resources.
2. Improves Data Accuracy
By eliminating manual data entry and processing, these tools significantly reduce the risk of human errors, ensuring more reliable and consistent data across reports.
3. Provides Real-Time Insights
With real-time data updates and live dashboards, businesses can access the most current information instantly, enabling faster responses to market changes and performance shifts.
4. Enhances Decision-Making
Accurate, up-to-date insights empower teams and leaders to make informed decisions quickly, leading to better business outcomes and improved strategic planning.
5. Boosts Productivity
Automation removes repetitive tasks, allowing teams to focus on high-value activities such as strategy, analysis, and business growth rather than manual reporting.
6. Reduces Operational Costs
By minimizing manual labor and improving efficiency, reporting automation tools help reduce overall operational costs and optimize resource allocation.
7. Ensures Scalability
As businesses grow and data volumes increase, reporting automation tools can easily scale to handle large datasets without compromising performance or speed.
Types of Reporting Automation Tools
Reporting automation tools are categorized based on their purpose and usage. Below are the main types:
1. Business Intelligence (BI) Tools
- Advanced data analysis and reporting
- Interactive dashboards and visualizations
- Identify trends and patterns
- Ideal for strategic decision-making
- Best for large businesses and enterprises
2. Marketing Reporting Tools
- Track ad campaigns and performance
- Measure ROI, clicks, and conversions
- Integrate with Google Ads, social media, email tools
- Generate automated marketing reports
- Best for marketers and agencies
3. Financial Reporting Tools
- Automate financial statements (P&L, balance sheet)
- Track revenue, expenses, and cash flow
- Ensure compliance and accuracy
- Reduce manual accounting work
- Best for finance teams and businesses
4. Operational Reporting Tools
- Monitor daily operations and workflows
- Track KPIs and performance metrics
- Identify inefficiencies and bottlenecks
- Improve productivity and processes
- Best for operations managers
5. Dashboard Reporting Tools
- Real-time data visualization
- Display KPIs in charts and graphs
- Easy-to-understand dashboards
- Quick decision-making support
- Best for teams needing instant insights
How to Choose the Best AI Reporting Tool
Choosing the right tool is critical for your business success.
- Identify Your Needs – Decide whether you need marketing, financial, or business intelligence (BI) reporting.
- Check Integrations – Ensure compatibility with your existing tools like CRM, databases, and marketing platforms.
- Evaluate Ease of Use – Choose tools with a simple interface, easy dashboards, and a minimal learning curve.
- Consider Budget – Compare free and paid plans based on features, scalability, and long-term value.
- Look for Scalability – Ensure the tool can handle growing data and business needs over time.
- Test Free Trials – Always test the tool with real data before making a final decision.
Challenges of Reporting Automation
- Initial setup complexity
- Learning curve
- High cost for advanced tools
- Integration issues
- Data privacy concerns
Use Cases of Reporting Automation Tools
- Marketing performance tracking
- Sales reporting
- Financial reporting
- Website analytics
- Customer insights
- Operational monitoring
Pros and Cons Table
|
Tool |
Key Strength |
Main Limitation |
|
Improvado |
Marketing-focused automation |
Expensive |
|
Tableau |
Best visualization |
Steep learning curve |
|
Power BI |
Affordable & powerful |
Limited customization |
|
Looker Studio |
Free & simple |
Basic features |
|
Klipfolio |
Great for KPIs |
Limited scalability |
|
Zoho Analytics |
Budget-friendly |
Slower with big data |
|
Domo |
Real-time enterprise data |
High cost |
|
Databox |
Easy dashboards |
Limited analytics |
|
Sisense |
Handles big data |
Complex setup |
|
GA4 |
Free & powerful |
Hard to learn |
Future Trends in Reporting Automation
- AI-powered insights
- Predictive analytics
- Natural language reporting
- Real-time data processing
- Cloud-based reporting
Editor's Choice: Best Reporting Tools in 2026
If you don’t want to compare all tools, here are the best picks:
- Best Overall: Microsoft Power BI
- Best for Enterprises: Tableau, Domo
- Best Free Tool: Looker Studio, GA4
- Best Budget Option: Zoho Analytics
- Best for Marketing: Improvado
- Best for KPI Tracking: Databox
Conclusion
Reporting automation tools have become essential for modern businesses that rely on data for decision-making. They eliminate manual reporting, improve accuracy, and provide real-time insights that help teams act faster and smarter.
The best tool depends on your needs Power BI is ideal for affordability and performance, Tableau for advanced analytics, and Looker Studio for free reporting.
Choosing the right tool can significantly improve your business efficiency and competitive advantage.
Frequently Asked Questions
1. What is a reporting automation tool?
A reporting automation tool is software that automatically collects, processes, and visualizes data from multiple sources to create reports and dashboards without manual effort.
2. Which reporting tool is best?
The best tool depends on your needs. Power BI is great for affordability, Tableau for advanced analytics, and Looker Studio for free reporting.
3. Are reporting automation tools free?
Some tools like Looker Studio and Google Analytics 4 are free, while others offer paid plans for advanced features.
4. Do these tools require coding?
Most reporting tools are no-code and beginner-friendly, although advanced customization may require technical knowledge.
5. Can small businesses use these tools?
Yes, many tools like Databox, Zoho Analytics, and Looker Studio are designed specifically for small businesses.